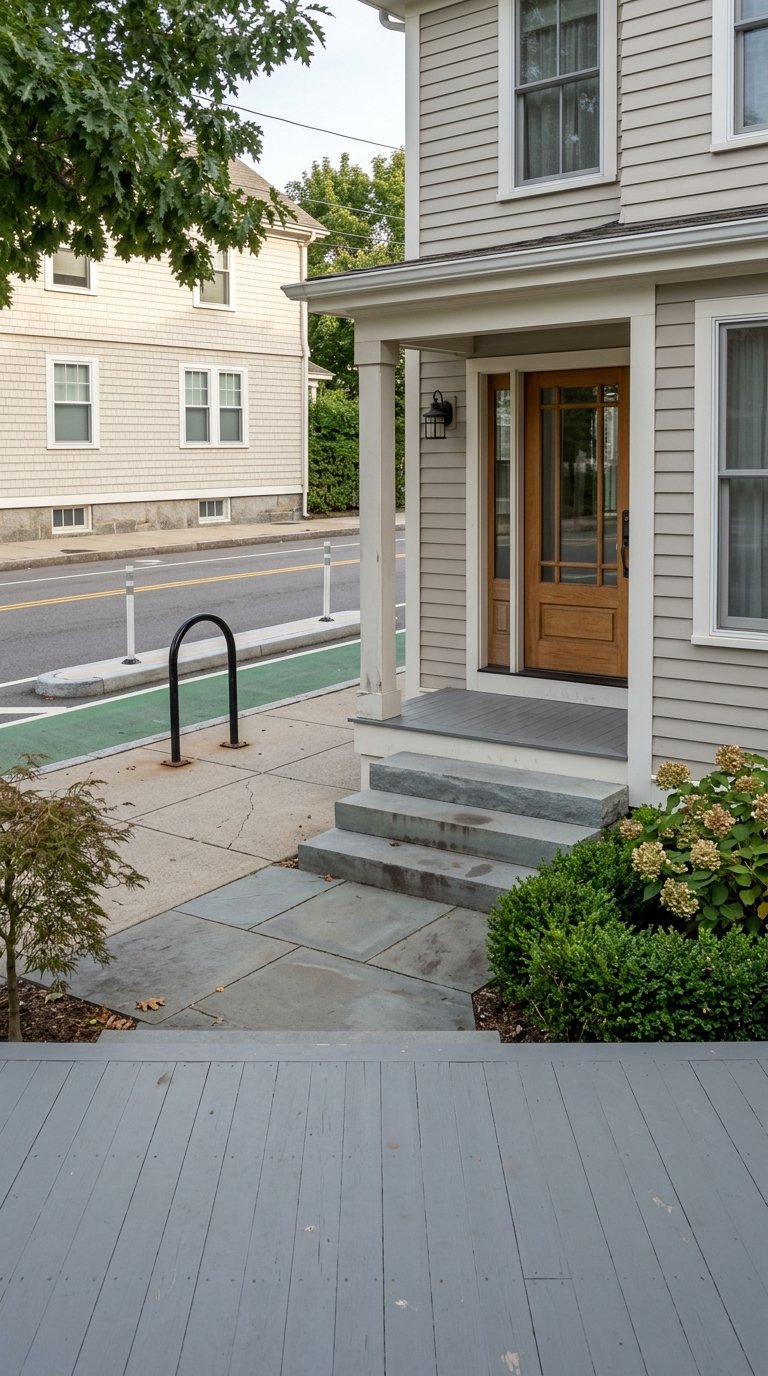
Thinking about buying or selling in the Bronx but unsure what the numbers really mean right now? You are not alone. With headlines that do not always agree, it is easy to feel stuck on the sidelines. In this guide, you will get a clear, plain‑English read on prices, inventory, and how to shape a smart plan in today’s market. Let’s dive in.
Bronx market snapshot (Jan 2026)
- Redfin, Jan 2026: median sale price $650,000; median days on market 64; sale‑to‑list ratio 98.5%; about 29.1% of homes sold above asking.
- Realtor.com, Dec 2025: active listings about 1,500; average days on market 96.
- Zillow, data through Jan 31, 2026: typical home value (ZHVI) $491,230, about +4.7% year over year.
These sources measure different things. Redfin focuses on recent sold prices and speed. Realtor.com captures what is currently for sale and how long active listings sit. Zillow’s ZHVI is a smoothed index that tracks trend direction rather than exact comps. Reading all three together gives you a balanced picture.
How to read the numbers
- Price medians vary by source and date. Do not be alarmed by the spread. Use sold data for offer strategy and ZHVI to understand longer‑term movement.
- Days on market also differ. Sold DOM near two months suggests solid demand. Active‑listing DOM near three months says some sellers are negotiating on timing and price.
- A sale‑to‑list ratio near 98 to 99 percent means sellers are getting close to asking on average. About three in ten closings still go over asking, which signals targeted competition for the most compelling homes.
Inventory and your negotiating power
Late 2025 into January 2026 brought more listings across the city, which opened up choices for buyers and took some heat off asking prices in parts of the Bronx. Realtor.com’s count of about 1,500 active listings in December lines up with what many buyers felt on the ground: more showings to pick from than in 2024. Rising inventory typically widens your negotiation room, but well‑priced homes that show clean still move quickly and close near ask.
Provider counts differ because each platform pulls from different listing feeds. For a full picture at the building and neighborhood level, local MLS data is best. The big takeaway is simple: you have more options than a year ago, but you still need to be ready when a standout listing hits.
Prices and pace: short‑term vs long‑term
Short‑term movement: The Redfin Jan 2026 median sale price sits at $650,000 with a median 64 days on market. That suggests a steady market where buyers can act thoughtfully, not in a rush, but should still lead with strong, clean offers on the top listings.
Long‑term trend: Zillow’s ZHVI shows a roughly 4.7% year‑over‑year rise through Jan 2026, which points to modest, positive momentum. ZHVI is a seasonally adjusted index that smooths the noise you see month to month. Pair it with recent sold comps in your target neighborhood to set realistic expectations.
Property types: what is most competitive
Public records confirm the Bronx is a mix of one‑family, two‑family, and three‑family homes, with many co‑op sales and walk‑up rental buildings. You can see this in the Bronx rolling sales file from the NYC Department of Finance, which shows sale prices, dates, and building classes.
MLS and regional briefs in 2025 highlighted strong activity at times for single‑family homes and co‑ops, while condos were more up and down by month. That pattern backs a practical point: competitiveness depends on the segment, not just the borough. You can scan a representative example in HGAR’s OneKey MLS monthly report.
What this means for first‑time buyers
Co‑ops and some smaller condos are often the most affordable entry points. Expect a review process for co‑ops and plan for maintenance charges in your monthly budget. Use very recent sold comps and board requirements to set your price ceiling and timing.
What this means for move‑up families
Single‑family homes and larger two‑family properties appeal to buyers who want more space and flexible layouts. With the sale‑to‑list ratio near 98.5%, there is usually limited room for deep discounts when a home is priced right. Focus on the last 3 to 6 months of neighborhood comps and be ready with financing so you can act when the fit is clear.
What this means for small investors
Two‑ to four‑family properties and small walk‑up buildings remain active. Underwrite conservatively. Verify actual rent rolls, expenses, and any open permits. Cross‑check recent neighborhood sales in MLS and the DOF rolling sales by building class and date to avoid overpaying.
Offer strategies that fit today
- For move‑in‑ready single‑family homes or clean co‑ops, consider a first offer near list with a small competitive element. Redfin’s Jan 2026 sale‑to‑list ratio of about 98.5% and roughly 29% of sales over asking suggest sellers still expect strong terms on standout listings.
- If a property has been on the market longer than the local median or has seen price reductions, open with a tighter range. Depending on condition and days on market, a 3 to 6 percent discount request is common. Pair that with clear inspection timelines and flexible closing terms to keep the deal moving.
- Investors should base offers on verified income and realistic cap rate targets. Use recent comparable sales and actual operating data, not just list rents. Confirm building class and transfer history in the Bronx DOF file.
Timing your move in 2026
- Buyers: More inventory means more choice, especially early in the year. Get pre‑approved, define your must‑haves, and preview listings fast. When the right home appears, lead with clean terms and a realistic price anchored to recent sold comps.
- Sellers: Price to the market you have, not the one you remember. If your home aligns with recent comps and shows well, you can still achieve near asking with solid terms. If you are targeting a specific closing window, list early and respond to feedback quickly to avoid sitting.
- Everyone: Neighborhoods in the Bronx vary widely by price band and property type. County medians are helpful for context, but your decision should ride on ZIP‑level comps and your personal timeline.
How we help you move with confidence
You deserve clear advice, data that makes sense, and a plan that fits your goals. As a Bronx‑rooted brokerage with modern tools and MLS access, we guide you step by step, from first tour to final signatures. If you are thinking about buying, selling, or investing in the Bronx or nearby suburbs, let’s talk about a path that works for you.
Ready to make a smart move in 2026? Connect with Rahhim Shillingford to Start Your VIP Home Search today.
FAQs
What is the current median home price in Bronx County?
- Redfin reports a median sale price of about $650,000 in January 2026, while Zillow’s ZHVI shows a typical home value near $491,230 through Jan 31, 2026, reflecting different methodologies.
Are Bronx buyers or sellers in control right now?
- With more listings than a year ago and a sale‑to‑list ratio near 98 to 99 percent, the market is more balanced, though well‑priced homes still favor sellers.
How fast are homes selling in the Bronx?
- Redfin shows a median of about 64 days on market for recent sales, while active listings on Realtor.com averaged about 96 days in Dec 2025, indicating steady but selective demand.
Which property types see the most activity in the Bronx?
- Single‑family homes and co‑ops often move fastest when priced right, while two‑ to three‑family properties attract investors; the DOF rolling sales file confirms a broad mix by building class.
How should first‑time buyers approach co‑ops in the Bronx?
- Review board requirements early, factor maintenance charges into your budget, and use very recent sold comps to set a limit before you write an offer.
What should small investors verify before offering on a 2–4 family?
- Confirm rent rolls, expenses, condition, and comparable sales, then validate building class and transfer history in the Bronx DOF records to support your cap rate assumptions.